MLB Home Run Prop Betting: Ballpark Splits as a UK Punter’s Edge
 Available in US
The Cincinnati Afternoon I Got Lucky
I placed a “to hit a home run” prop in July 2024 on a Reds outfielder I had no business having an opinion on, at decimal 5.50 from a UK book during a Saturday afternoon special. The temperature in Cincinnati was 32 degrees, the wind was blowing out to right at 14 mph, the opposing starter was a fly-ball right-hander, and Great American Ball Park already plays as one of the most extreme home-run venues in baseball. The ticket cashed by the third inning. I called it luck at the time. Looking back now, I had unconsciously stacked four independent variables in my favour and bet a player at a price the operator had not adjusted for any of them.
That afternoon taught me that the home-run prop is the single most asymmetric prop market the UK calendar offers. Operator prices typically sit in the decimal 4 to 7 range, the variance is enormous on any given ticket, and the underlying probability is heavily multiplied by a small number of factors that the morning pricing engine consistently fails to fully capture. The next sections are about reading those factors deliberately rather than stumbling into them, because the home-run prop rewards the punter who has done thirty minutes of research more than perhaps any other market on a UK app.
How the Home Run Prop Mechanic Works
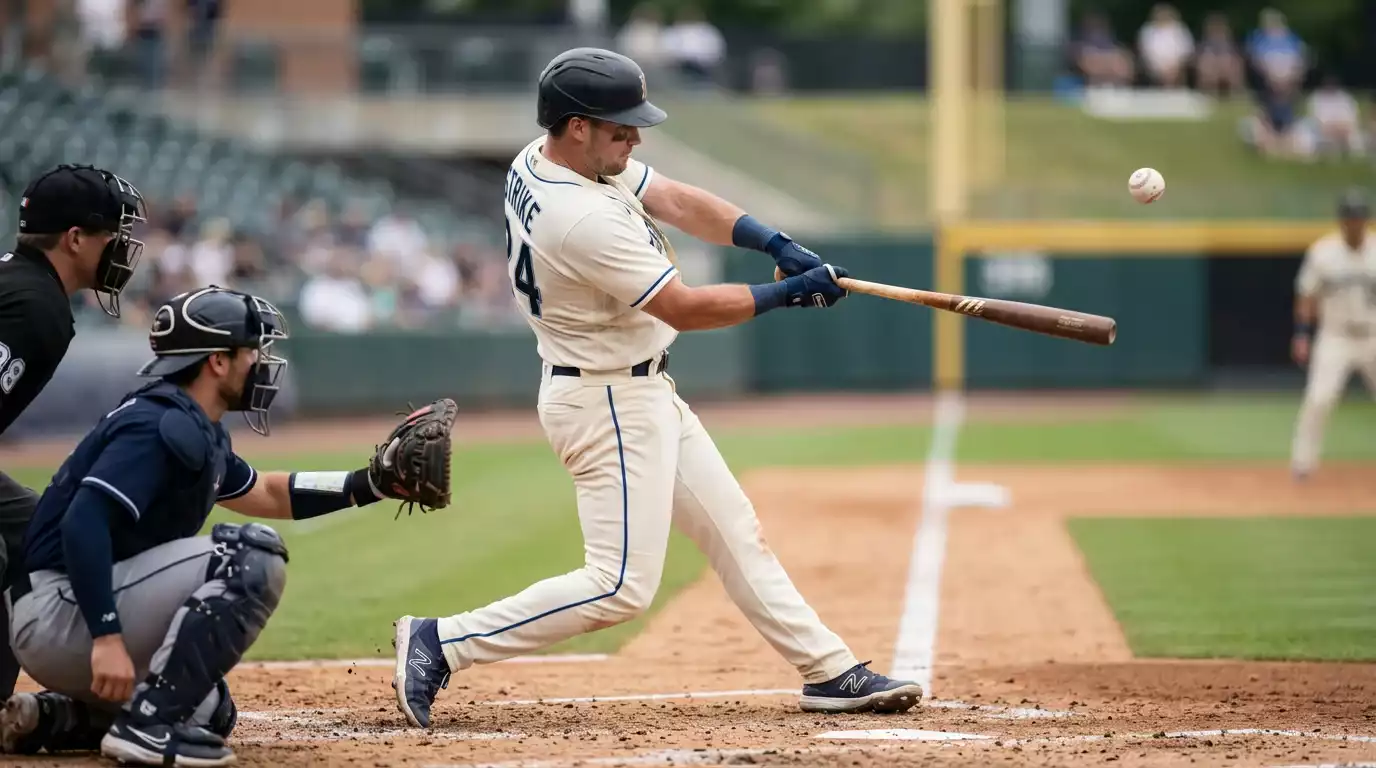
The “to hit a home run” prop on a UK book settles as a single yes/no outcome on whether the named player hits at least one home run during the game. Multi-home-run props exist as separate markets, but the headline ticket is the binary version. The operator prices it as decimal odds against the player’s projected probability of homering at least once, with the implied probability typically running between 14% and 25% for a regular position player at a neutral venue.
The mechanic underneath is straightforward. The operator’s projection model takes the player’s home-run-per-fly-ball rate, multiplies by his expected number of plate appearances, adjusts for the opposing starter’s fly-ball rate, applies a park factor for home runs, and outputs a probability. That probability becomes the implied figure inside the decimal price, with operator margin layered on top. The model is general – it works across a 162-game schedule and produces sensible average prices – but it is rarely calibrated for the specific day’s weather and lineup conditions.
The structural opportunity is in the gap between the general model and the specific day. A player with a 12% home-run-per-fly-ball baseline at a neutral venue might face a day where every multiplier – temperature, wind, park factor, pitcher matchup – sits in his favour, and the underlying probability for that specific game might run closer to 22%. The operator price will reflect a probability somewhere between the baseline and the day’s reality, but it will rarely fully reach the day’s reality. The punter who can identify those days has the edge on the home-run prop.
The Temperature and Wind Multipliers
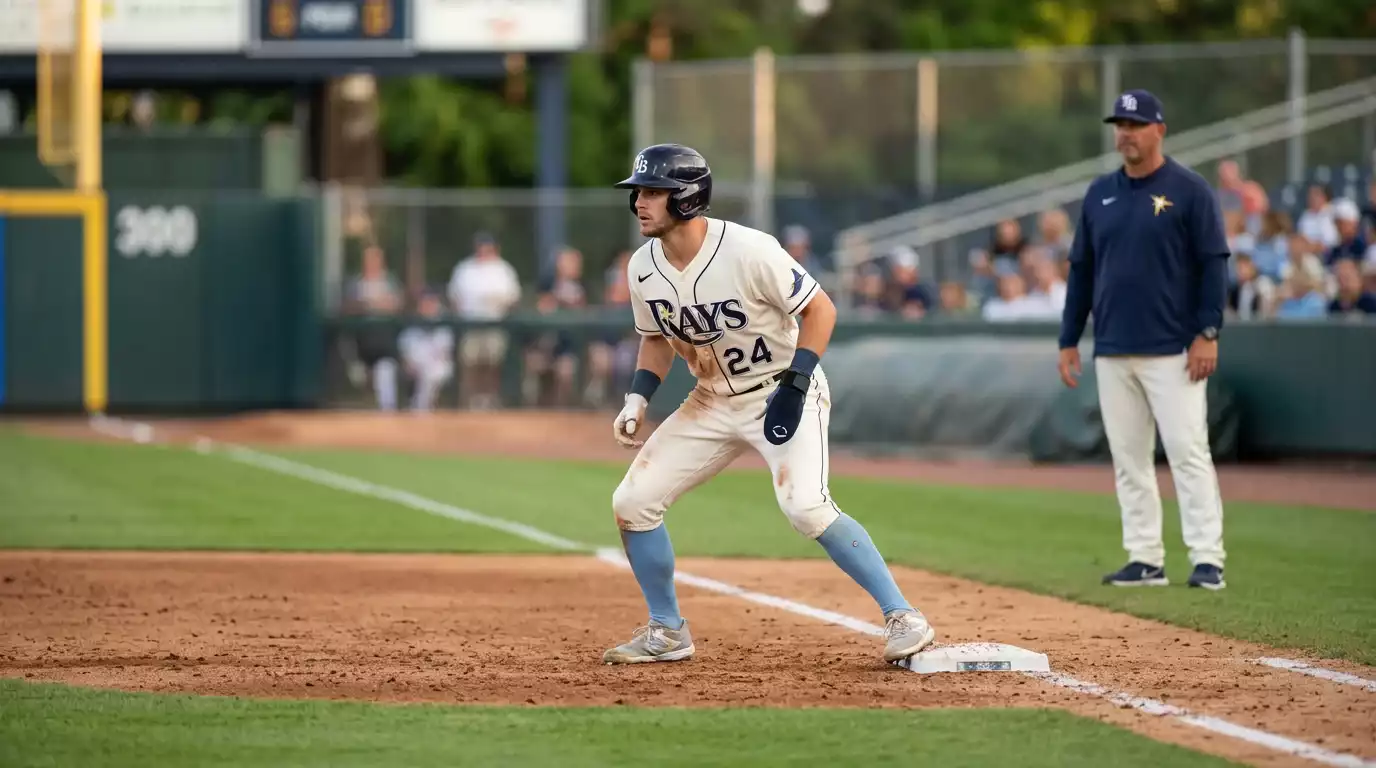
Of all the factors that shift home-run probability, temperature is the cleanest single variable. The relationship is well-established: each degree Celsius above the venue’s seasonal average lifts home-run probability by roughly 1.96%. That figure is small per degree but compounds quickly. A summer afternoon at 30 degrees against a venue’s June average of 22 degrees represents an eight-degree positive swing, which lifts the underlying home-run probability by close to 16%.
Wind direction and speed compound the temperature effect. A steady out-blowing wind to the pull side of a power hitter at 10 to 15 mph adds another meaningful percentage to the underlying probability. Wind blowing in is the reverse – it depresses home-run probability and the operator price often does not fully discount the under direction, which makes home-run unders a contrarian play on cold windy days at fly-ball-friendly venues. The combined effect of temperature and wind is rarely a single small adjustment; on the right day at the right venue, the cumulative multiplier on a power hitter’s baseline can approach 50%.
The cleanest workflow I have built is a simple matrix: temperature swing in degrees, wind speed and direction relative to the player’s pull side, and the player’s career home-run-per-fly-ball rate. If the matrix produces a multiplier above 1.30 against the operator’s implied probability, the prop is on my watchlist. If the multiplier is below 1.10, the prop is either fairly priced or under-priced and I move on. The discipline of applying the matrix consistently is more important than the precise multiplier values, because the consistency is what compounds across a season.
Ballpark Home Run Factors That Actually Matter
I keep a small mental tier list of MLB venues by home-run factor, and the tier list anchors every home-run prop decision. The high-end tier – Coors Field in Denver, Great American Ball Park in Cincinnati, Yankee Stadium for left-handed hitters – produces home runs at rates roughly 15-25% above the league average. The low-end tier – Oracle Park in San Francisco, Petco Park in San Diego, Comerica Park in Detroit – depresses home runs by similar margins.
The pitch clock has not materially changed park factors, even though it has compressed game length to roughly two hours and thirty-eight minutes on average – the third consecutive year under two hours and forty minutes. What it has changed is the consistency of in-game conditions: shorter games mean less variance in temperature, wind, and humidity from first pitch to final out. A summer evening that starts hot and humid no longer cools meaningfully by the seventh inning the way it might have in a four-hour 2018 game. For home-run prop pricing, that consistency works in the punter’s favour – the conditions you assess at first pitch are now the conditions that hold across the at-bats that matter.
The structural quirk worth knowing is that some venues play asymmetrically – Yankee Stadium’s short porch in right field heavily favours left-handed power hitters, while Fenway’s Green Monster favours right-handed hitters on doubles but has limited home-run effect. Reading the venue against the player’s batted-ball spray pattern is part of the workflow, and the operator pricing rarely fully captures the asymmetry. As Rob Manfred has observed about the league’s overall acceptance of operational changes – including PitchCom and the pace-of-play package – the league has settled into a new equilibrium of consistent game conditions that makes the punter’s research more reliable rather than less.
Pitcher Fly-Ball Tendencies
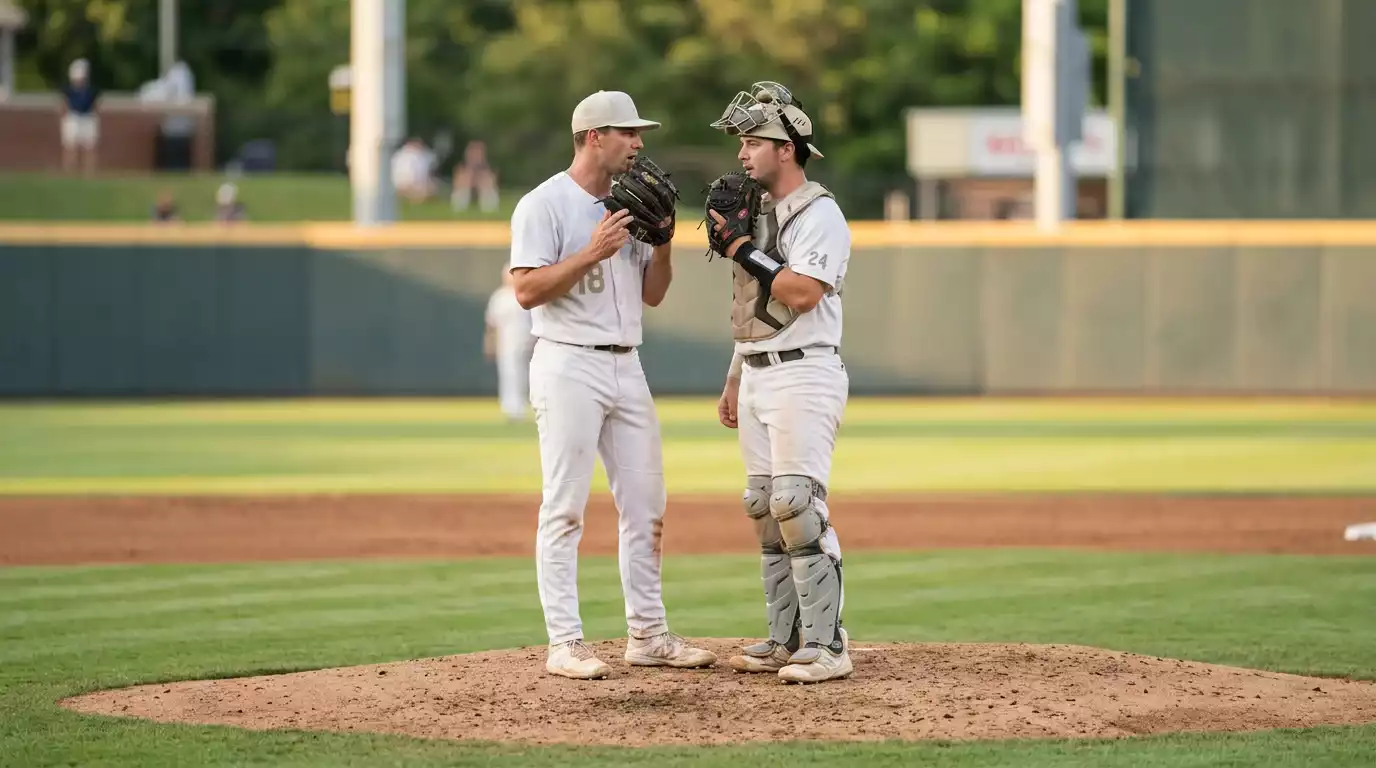
The fourth multiplier on the home-run prop is the opposing pitcher’s fly-ball rate and home-run-per-fly-ball rate. A starting pitcher with a 45% fly-ball rate against right-handed batters is fundamentally different prey for a right-handed power hitter than a starter with a 30% fly-ball rate. The operator’s model uses the season-long average, but the recent split – last 30 days, last five starts – often diverges meaningfully from the season average, particularly mid-season when a starter is going through a mechanical adjustment.
The cleanest signal in the pitcher data is the home-run-per-nine-innings rate split by handedness. A right-handed starter giving up 1.5 home runs per nine to right-handed batters is the kind of matchup where the home-run prop on a right-handed power hitter can be structurally under-priced, especially when paired with favourable park and weather conditions. The reverse – a left-handed starter with elite home-run suppression numbers against same-handed batters – is usually a structural under on the prop for any left-handed hitter facing him at a neutral or pitcher-friendly venue.
The other pitcher factor is recent velocity trend. A starter whose velocity has dropped 1-2 mph over recent starts is meaningfully more vulnerable to home runs than the season-long projection suggests, because reduced velocity correlates with hangers, mistake pitches, and pitches that catch more of the plate. The pitch clock environment shows this signal clearly because games are too short to mask a fatigued starter’s deterioration through inning-by-inning recovery – there were just three games of three hours and thirty minutes or longer in 2025, compared with 391 in 2021, and that compression means a starter’s stuff either holds or doesn’t, with limited time to recover between innings.
Building a Daily Home Run Shortlist
The output of the four-multiplier workflow is a daily shortlist of home-run prop candidates where the underlying probability meaningfully exceeds the operator’s implied price. I keep the shortlist to a maximum of three tickets per match day, because home-run props are high-variance enough that spreading attention across more than that produces too much portfolio noise to read the results cleanly.
The structural rule I apply to the shortlist is that every candidate must pass at least three of the four multiplier checks. A power hitter with favourable temperature, favourable park factor, and a fly-ball-prone opposing starter can land on the list even if the wind is neutral. A hitter with only one favourable factor – say, just a hot day – does not make the list, because the cumulative multiplier is not large enough to overcome the operator’s margin reliably. The discipline of the three-out-of-four threshold is what filters out the marginal tickets that look attractive but do not actually clear the EV bar.
The shortlist also includes a stake-size protocol. Home-run props are high-variance, so I size each ticket at the lower end of my normal stake band – typically half of what I would stake on a moneyline – and I treat the multi-day variance as part of the cost of the market. Across a season, the cumulative ROI on a disciplined home-run shortlist has comfortably outperformed my hits-prop and total-bases-prop ROI, but the season’s variance arc is much rougher and the punter who size-mismatches can wipe out two months of edge in a single bad week. For the broader morning routine that feeds into the home-run shortlist, my piece on the MLB strikeout prop betting and pitcher matchups covers the pitcher-side workflow that interlocks with home-run analysis.
Where the Home Run Prop Quietly Pays
The honest summary of home-run prop betting in the UK is that the market rewards careful pre-game research and punishes lazy ticket-clicking more brutally than perhaps any other prop market. The four multipliers – temperature, wind, park, pitcher tendency – compound into a probability estimate that the operator’s morning pricing engine simply does not fully capture, and the punter who applies the multipliers consistently extracts measurable value across a season. The variance is high enough that any single ticket means little, and the stake-size discipline matters as much as the selection process. But the cumulative arithmetic on a disciplined home-run shortlist is one of the cleanest edges the UK MLB market currently offers, and it is available to anyone willing to spend thirty minutes on the morning research before the lineups confirm.
What is the typical decimal price range on a home run prop?
UK operators usually price the to hit a home run prop between decimal 4.0 and 7.0, with implied probabilities running from 14 percent to 25 percent depending on the player, opposing pitcher, park, and weather conditions.
How much does temperature affect home run probability?
Each degree Celsius above the venue’s seasonal average lifts home-run probability by roughly 1.96 percent. An eight-degree positive swing on a summer afternoon represents close to a 16 percent lift in underlying probability.
Are home run unders ever good value?
Yes. On cold windy days at fly-ball-friendly venues against ground-ball pitchers, the operator price often does not fully discount the under direction, and the contrarian play can offer real value at decimal prices in the 1.20 to 1.40 range.
Prepared by the mlb Best bet Firm editorial staff.