Weather Metrics and MLB Totals: Wind Impact on Over/Under Lines
 Available in US
- Real-World Examples of Wind Affecting Baseball Totals
- Temperature and what warmth does to a struck baseball
- Wind direction is the variable that flips games entirely
- Humidity and air density: the subtle layer most punters miss
- Roofed and dome stadiums change every assumption
- Putting weather into a repeatable workflow
Real-World Examples of Wind Affecting Baseball Totals
It was a Sunday in late June and I had four MLB totals queued up on my UK app, ready to fire before lunch. The bookmaker had posted a 9.0 over/under on the Cubs game at Wrigley. I was leaning over because the matchup was a fly-ball pitcher against a power-heavy lineup. Three minutes before I tapped the stake button, I noticed the wind feed: 14 mph blowing straight in from Lake Michigan. I held off, watched the game, and the final score was 2-1. Wind direction had taken what looked like a routine over and turned it into one of the most one-sided unders of the day.
That afternoon crystallised something I had been half-tracking for years. Weather is the cleanest publicly available variable that meaningfully moves an MLB total, and most UK operators react to it more slowly than American sharp shops do. The line I was looking at had not adjusted for the wind because the line had been posted twelve hours earlier when the forecast was different. The bookmaker’s risk team would update eventually, but probably not in the ninety-minute window when public bettors were locking in tickets. That gap is the whole reason I now check the weather feed before I check the lineups.
Most UK readers come to MLB without the casual familiarity with American climate that US-based fans have. Texas in July, Seattle in April, and Phoenix any time the roof is open all play very different baseball weather, and getting comfortable with the basic patterns is the foundation for using weather as a betting filter rather than a curiosity.
While wind direction is crucial, you must always combine weather data with MLB ballpark factors to truly predict if a game will go over the total.
Temperature and what warmth does to a struck baseball
Temperature is the most predictable lever in MLB weather. Warmer air is less dense, balls travel further, and across the league a one-degree-Celsius rise in daytime temperature lifts home-run output by a measurable 1.96 percent. That is a small per-degree number, but it is cumulative and reliable, and it stacks across temperature ranges that swing twenty degrees between an April night and a July afternoon at the same park.
The implication for totals betting is straightforward. The opening line on a regular-season MLB total is essentially a mid-temperature average. If the actual game-time forecast is well above seasonal norms, the total is structurally too low. If it is well below, it is structurally too high. Over a full season, a punter who consistently identifies the high-temperature outliers and bets overs on them, or the cold-weather outliers and bets unders, captures a small but stable edge that compounds.
The cleanest spots are mid-summer afternoon games at parks that are already hitter-friendly. A 32-degree afternoon at Globe Life Field in Arlington with humidity above 60 percent is a different sport from the cooler, drier April version of the same matchup. The lineups are the same, the starters are the same, but the run environment shifts meaningfully. If the bookmaker has not adjusted the total to reflect that shift – and they often will not move it more than a quarter of a run, even when the forecast justifies a half-run move – you have a workable lean.
The reverse pattern applies at cold-weather parks early and late in the season. April baseball in Detroit, Cleveland, or Cincinnati at 7 °C with light winds plays meaningfully under league averages on totals. The lines reflect this loosely but not precisely, and the early-April and late-September windows are where pitcher-friendly weather creates a steady drumbeat of small unders.
Wind direction is the variable that flips games entirely
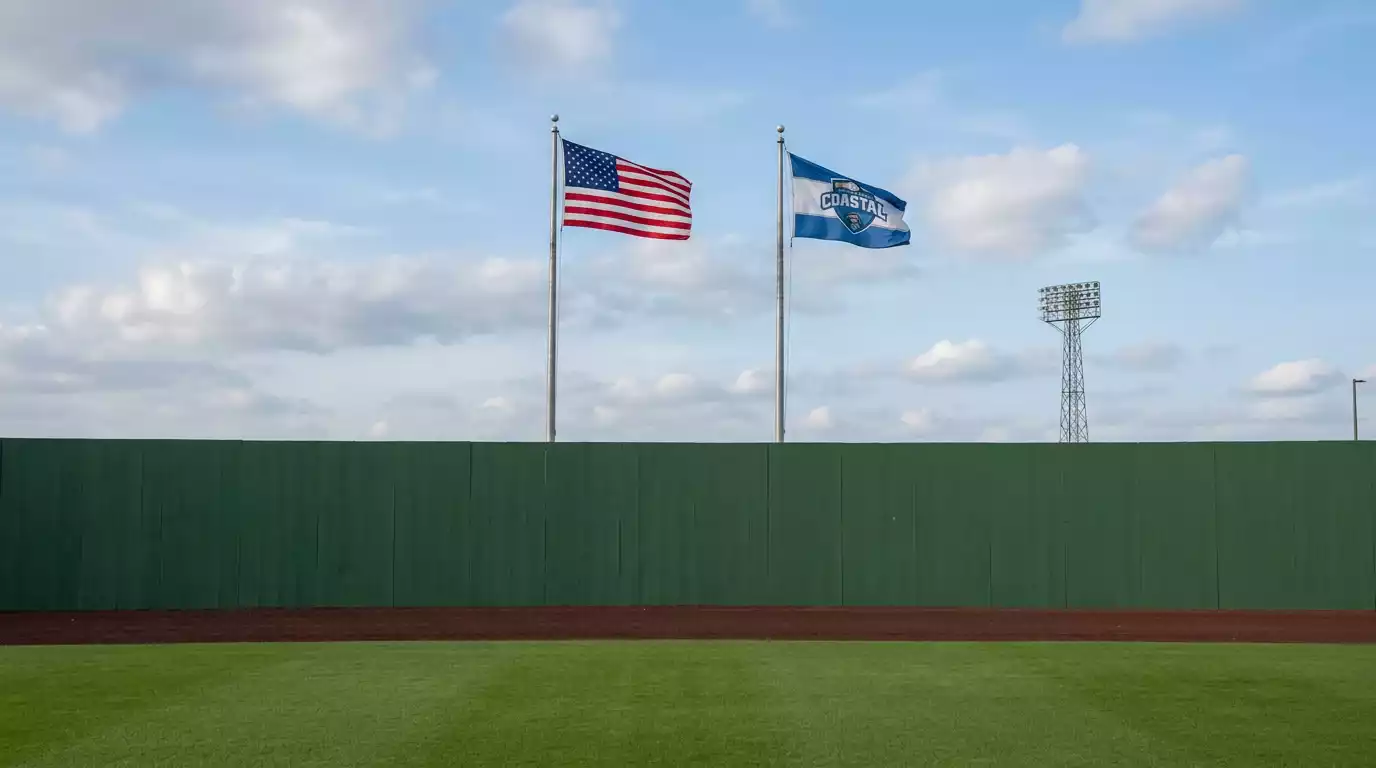
Wind is where the temperature edge gets multiplied or cancelled. Direction matters more than speed, and “out” versus “in” at any given park changes the math more than ten degrees of temperature does. A 10-mph wind blowing straight out at Wrigley Field can convert a slightly hitter-friendly park into one of the most extreme launching pads in baseball. The same wind blowing straight in turns Wrigley into a pitcher’s haven where overs go to die.
The threshold I use is roughly 8-mph as the floor where wind starts to matter and 12-mph as the level where it dominates the matchup. Below 8-mph, wind is a rounding error against the rest of the variables. Between 8 and 12, it is a tilt – meaningful but not decisive. Above 12, it is the largest single variable in the game’s run environment, regularly large enough to move the implied total by a full run in either direction.
The asymmetry that punters miss: wind blowing out increases run scoring by raising home-run probability, but wind blowing in suppresses scoring across multiple categories at once. A ball that would have been a home run becomes a deep flyout. A ball that would have been a deep flyout becomes a routine catch. A ball that would have been a routine catch becomes a wind-pushed double down the line. The compounding effect is why wind-blowing-in days produce more under wins than wind-blowing-out days produce over wins, given equal wind speeds.
Open-air parks where this matters most: Wrigley Field, Citi Field, Minute Maid Park (when the roof is open), Coors Field, Yankee Stadium, and the Polo-style configurations of newer venues. Roofed and dome stadiums neutralise this entirely, which is its own piece of information when comparing matchups across the slate.
Humidity and air density: the subtle layer most punters miss
Humidity behaves opposite to most people’s intuition. Damp air is less dense than dry air at the same temperature, because water molecules are lighter than the nitrogen and oxygen they displace. The practical betting implication: humid summer evenings produce more home runs than dry summer evenings of the same temperature. Houston in late July, Tampa in August, and the Texas-Arkansas-Louisiana corridor in mid-summer all sit in the high-humidity, high-home-run zone.
Where humidity gets really interesting is in the interaction with breaking-ball movement. Pitchers’ curveballs and sliders rely on grip and on the ball gripping the air to generate spin-induced movement. Very high humidity makes the ball slick, which dampens breaking-ball effectiveness, which gives hitters a small but real boost. The cumulative effect at sticky 95-degree summer games in southern parks is that fastball-heavy pitchers fare better than breaking-ball-heavy pitchers, and that information is occasionally not reflected in the totals line.
Dewpoint is a more precise indicator than relative humidity, because it accounts for temperature directly. A dewpoint above 18 °C in summer baseball is reliably correlated with elevated home-run rates. UK weather feeds do not always surface dewpoint cleanly, but it is available on most US-side resources, and for any totals bet on a southern park in July or August, it is worth the extra two minutes of research.
One subtlety: humidity behaves differently at altitude. Coors Field’s high-altitude environment is so dry most days that humidity changes only matter on rare unusually wet ones. Most of Coors’s run inflation comes from the altitude itself, not the variable weather on top of it. The interaction matters most for parks at or near sea level.
Roofed and dome stadiums change every assumption
Approximately a third of MLB games are played in stadiums that can close their roofs or are permanently enclosed. Tropicana Field, the Rogers Centre in Toronto, Globe Life Field in Arlington, T-Mobile Park in Seattle, Chase Field in Phoenix, Marlins Park in Miami, and Minute Maid Park in Houston all have retractable or fixed roofs that can be closed for any given game.
The decision to open or close the roof depends on the operator and the conditions, and it can flip the entire weather analysis on a thirty-minute notice. Phoenix in summer routinely closes the roof for afternoon games to keep the stadium air-conditioned, which removes wind and locks the temperature at a steady 22 °C regardless of the 38 °C outside. That is a different game from an open-roof Phoenix evening when the air is cooler and dry, and the bookmaker’s totals line on a closed-roof game should be treated as essentially weather-immune.
The MLB front office has tracked exactly how technology alters the on-field environment, with the league’s executive vice president framing the broader pace-of-play conversation by saying that “we talked to minor-league players and coaches about the impact of shortened games” – and the same operational mindset extends to roof and dome decisions. Closed-roof games run faster, hit slightly harder on average than open-roof games, and remove the weather variable entirely.
The bet workflow for roofed games is simpler. If the roof is closed, ignore the weather feed entirely. If the roof is open and the matchup is at one of the convertible venues, treat it like any open-air park. Operator pages usually announce the roof status by mid-afternoon on game day, and that announcement is itself a piece of information – a roof closing late in the day suggests the operator expects rain or wind that the original line had not priced in.
Check the latest weather updates alongside the best MLB bets available today to maximize your edge.
Putting weather into a repeatable workflow
The way I integrate weather into bet decisions is through a four-checkpoint sequence that takes about ninety seconds per game. First, check the temperature forecast against the park’s seasonal average. Second, check the wind direction and speed. Third, note the dewpoint or humidity if the park is at or near sea level. Fourth, confirm the roof status if applicable.
If the readings push consistently in one direction – hot temperature, wind blowing out, high humidity at a sea-level park – I move toward an over lean. If they push consistently in the other direction – cool, wind blowing in, low humidity – I move toward an under. Mixed signals – say, hot and humid but with wind blowing in – usually mean pass, because the variables are cancelling and the underlying matchup is back to being the dominant factor.
Where to actually pull the readings: most US-based weather sites give you ballpark-specific forecasts down to the half-hour. Open the page, type in the city, and the wind direction relative to the diamond is the bit that matters. UK weather services give you the same temperature and rough humidity numbers but rarely surface stadium-specific wind direction, so for the wind read, US sources are worth the extra tab.
Sample-size discipline is essential. Weather-driven leans are real but small in expected value, on the order of a quarter to a half percent of EV per bet. Across a full season of disciplined application, that compounds, but only if you do not tilt your stake size up because the read feels strong. The 71.4 million tickets sold across the most recent regular season are a reminder of how many MLB games actually take place – across a slate of 2,430 games, you only need to convert a small fraction of weather-driven leans into clean ROI to make a meaningful difference at flat unit staking. The trick is taking the small edges as small edges, not as the green light to swing big. Pairing weather reads with the underlying park factor is what turns a one-variable insight into a reliably actionable filter.
How fast does wind direction need to be to move a total?
Below 8 mph, wind is essentially a rounding error against the other variables. Between 8 and 12 mph, it is a meaningful tilt that should shift your lean by a quarter-run or so on totals. Above 12 mph, wind becomes the dominant single variable in the game’s run environment and can move the implied total by a full run.
Do dome games erase the weather edge entirely?
Closed-roof games at retractable or fixed-roof stadiums neutralise temperature, wind, and humidity for that specific matchup. The totals line on a closed-roof game should be treated as essentially weather-immune, which is itself a useful piece of information when comparing across the slate. Always check roof status on convertible venues before staking.
Where can UK punters check pre-game wind data?
Most US-based weather services provide ballpark-specific forecasts down to the half-hour, including wind direction relative to the field. Type the city name into a major weather service and the wind direction overlay is the relevant data point. UK weather sites tend to give temperature and humidity cleanly but lack stadium-specific wind orientation, so a US tab is worth keeping open.
Prepared by the mlb Best bet Firm editorial staff.