MLB Player Prop Research: A Repeatable Workflow for UK Punters
 Available in US
The Morning I Stopped Eyeballing Props
I spent three years approaching MLB player props the same way I approached the moneyline – read the matchup, glance at recent form, click. The results were mediocre. Some weeks I would book a profitable run on hits props that felt like genius. The next month would erase those gains on home-run tickets that had felt equally clever. The breakthrough came on a wet Tuesday in March 2023, when I sat down with a notebook and wrote out every step I had actually taken on the previous five winning prop bets. The list was almost identical for all five. I had stumbled into a workflow without realising it.
That experience reshaped how I treat prop betting in the UK. Player props are the most information-asymmetric corner of MLB markets – the operator’s pricing engine knows the basic stats, but the daily reality of lineup construction, handedness matchups, pitcher fatigue, weather and ballpark conversion is difficult to model in real time. The punter who runs a repeatable morning routine on every match day captures the gap between the operator’s general projection and the day’s specific reality. The next sections lay out that routine in the order I now follow.
The Prop Types That Actually Pay
I have placed every flavour of MLB player prop the UK market offers, and I have settled into a small set of markets where the underlying probability is genuinely modellable on a daily basis. Hits props – over or under a half-run line on a player’s hit total for the game – are the cleanest market because the underlying frequency distribution is well-understood and the daily lineup variation creates real edge. Total-bases props add slugging context to the hits market and reward research on opposing pitcher quality and ballpark factor. Strikeout props on starting pitchers are perhaps the single most modellable prop on the calendar, because pitcher K-rate against the day’s opposing lineup is largely a function of K-rate vs whiff-rate maths.
Home-run props are the most volatile prop market, with typical decimal odds in the 4 to 7 range and a probability that swings sharply with weather and ballpark conditions. Run-scored and RBI props are usable but noisier, because the underlying outcome depends on lineup placement and the offensive performance of teammates rather than just the player himself. Stolen-base props are extremely match-specific and reward research on the opposing battery’s caught-stealing rate.
The market I now mostly avoid is the catch-all “first to score” or “last to score” prop – these are essentially headline-grabbing tickets with poor underlying value because the variance is enormous and the operator’s margin sits at the wide end of the typical range. The structural feature of all viable prop markets is that the operator prices them against a general projection, while the punter who runs daily research is pricing them against the day’s specific reality. That gap is the entire game. The November 2025 introduction of a $200 cap on pitch-level prop wagers and their removal from parlay eligibility narrowed one corner of this market, but the broader hits, total-bases, strikeout and home-run props remain unchanged and unaffected.
Step One: Lock the Lineup
The first thing I check every match day is the official lineup, and I do not place any prop bet until the lineups are confirmed. The reason is simple: a player who is not in the starting lineup cannot record a hit, a total base, or a home run, and props are typically refunded if the player does not start, but the value calculation of the prop only makes sense once you know who is actually playing.
The cleanest source for confirmed lineups is the team’s official social channels in the two-hour window before first pitch. National media outlets republish the lineups quickly, but the team’s own posts are typically the first confirmed source. The structural detail to internalise is that managers in 2026 routinely give regular position players a day off in the third game of a series, in the first game after a travel day, and on getaway-day afternoon games. Knowing the manager’s rest pattern across the season is part of the workflow – it allows you to spot likely rest days before the lineup posts, which gives you a head start on the markets that will reprice once the lineup confirms.
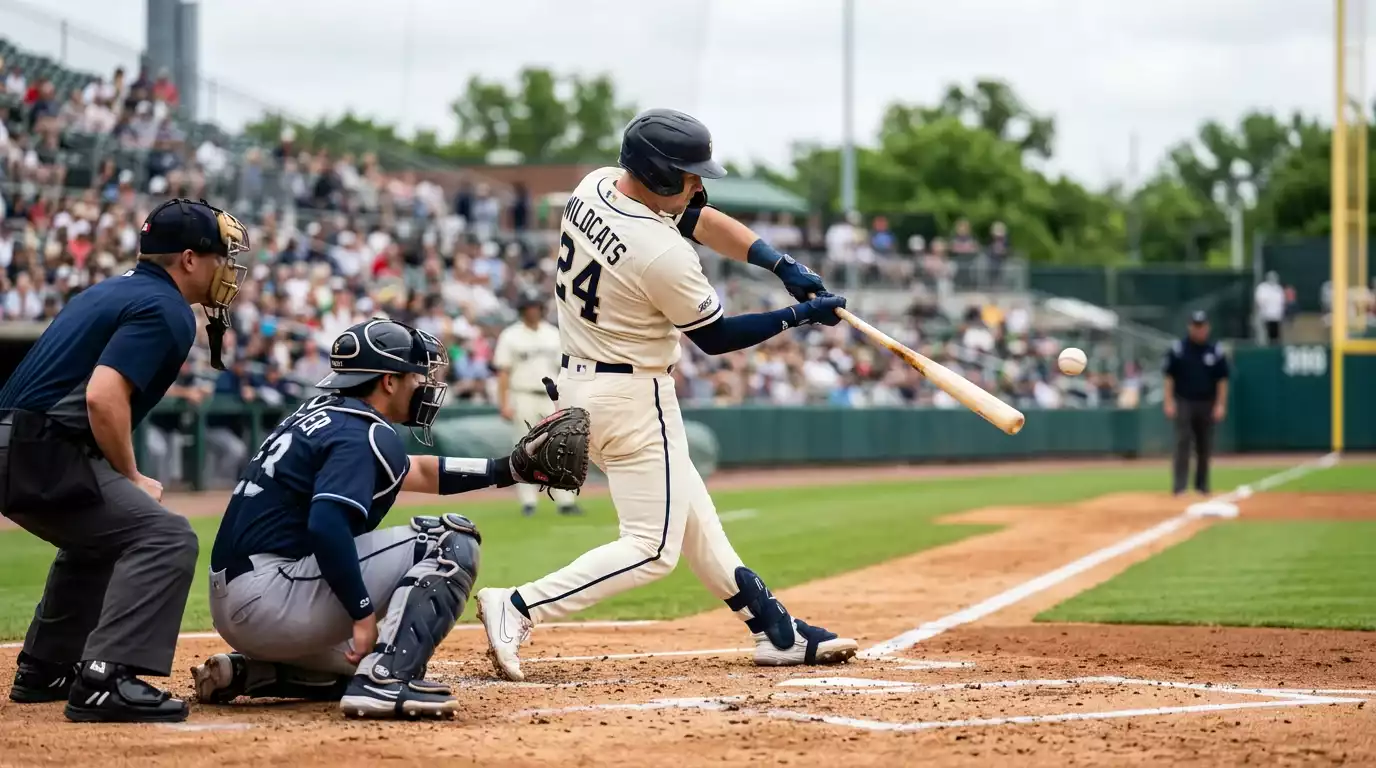
The second piece of the lineup check is the batting order position. A player slotted into the leadoff spot will typically see five at-bats, while a player slotted into the seventh or eighth spot will see closer to four. That extra at-bat materially shifts the probability of any over-line prop. The hits and total-bases markets are particularly sensitive to lineup position, and a player who has been bumped down two slots from his usual spot is often a quietly under-priced over on the next day’s hits prop because the operator’s engine has not fully adjusted for the lineup demotion.
Step Two: Map the Handedness Matchup
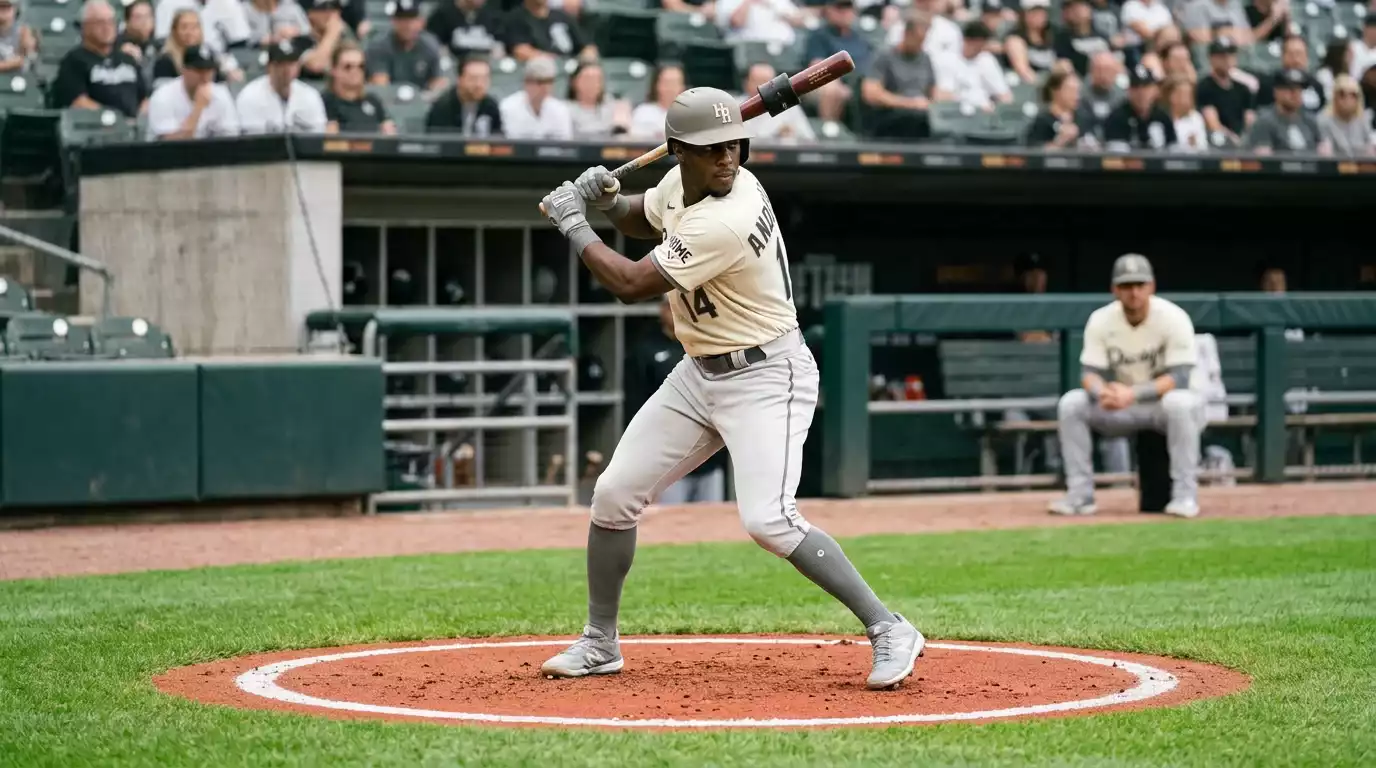
The second check on every prop bet is the handedness matchup. Right-handed batters generally hit better against left-handed pitchers and vice versa, and the magnitude of the platoon split varies meaningfully between players. Some hitters show extreme platoon splits – they essentially become different players against same-handed pitching – while others are platoon-neutral across their careers.
The data I rely on here is the player’s career split against the opposing pitcher’s handedness. A right-handed batter with a career OPS 150 points higher against left-handed pitching than against right-handed pitching will see his hits and total-bases probabilities meaningfully shift on days when he faces a southpaw. The operator’s pricing engine uses platoon-adjusted projections, but the engine averages across all platoon-adjusted scenarios while the punter is pricing the specific day. The value lives in the days where the platoon advantage is most extreme – a right-handed power hitter facing a left-handed starter with a long fly-ball pattern is a structural over on a home-run prop more often than the operator price reflects.
The reverse case matters too. A right-handed contact hitter facing a right-handed pitcher with elite slider command is often a structural under on a hits prop, particularly if the pitcher’s whiff rate against right-handers is in the top quartile. The handedness check is not glamorous research – it is fifteen seconds of looking up two career splits – but it is the single most consistently profitable filter I apply to prop selection.
Step Three: Read the Pitcher’s Fatigue Profile
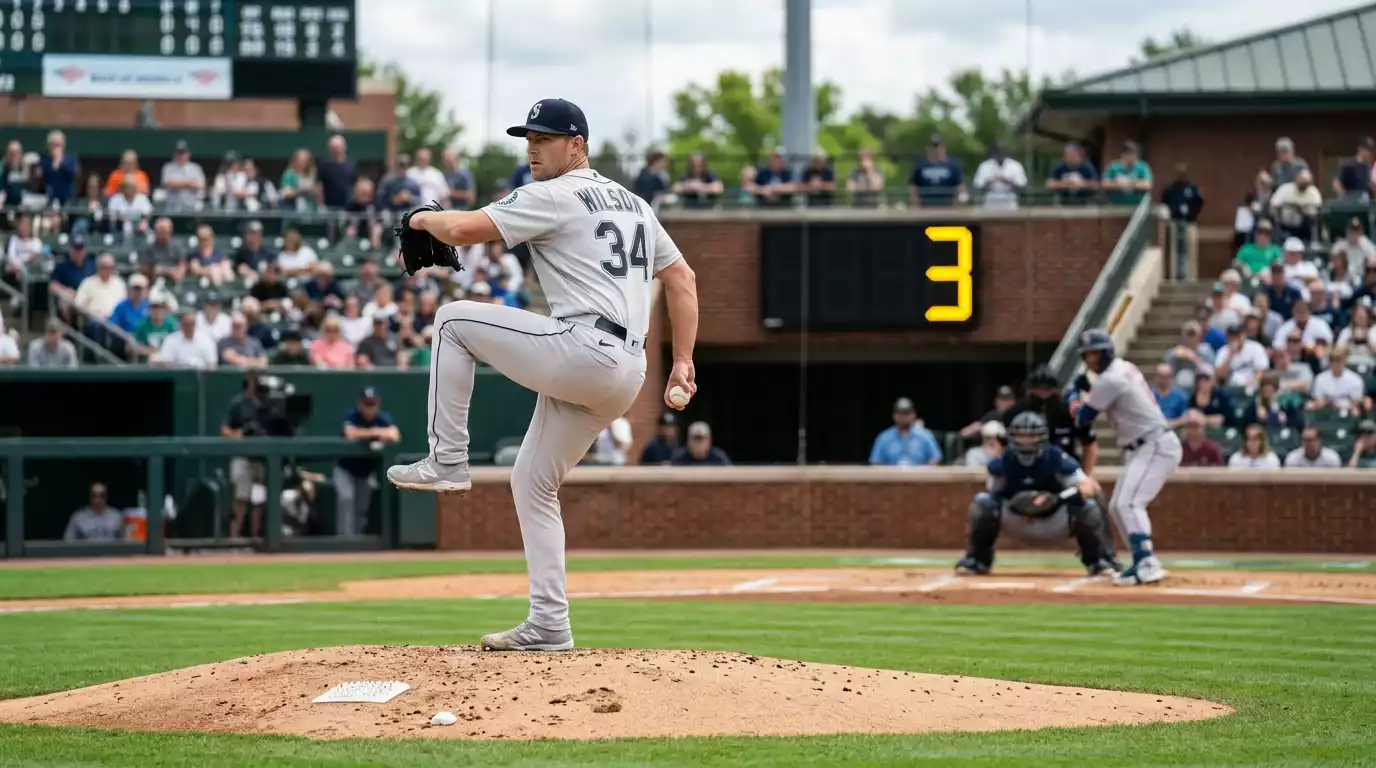
The third step is to assess the starting pitcher’s recent workload, and this matters as much for hitter props as for the strikeout prop on the pitcher himself. A starter coming off a 110-pitch outing on four days’ rest is rarely the same pitcher as one coming off a 90-pitch outing on five days’ rest. The fatigue profile shows up in pitch velocity, command, and time-through-the-order penalty, all of which feed into the hitter’s probability distribution for the day.
The cleanest fatigue signal is pitch count over the previous three starts combined with rest days. A starter accumulating 320+ pitches over three starts on standard rest is on the edge of the league’s typical fatigue threshold, and the next outing tends to underperform his season-long projection by a meaningful margin. Hitters facing a fatigued starter have measurably better probability of hits and total bases, and the strikeout-prop under on the pitcher tends to offer value in those scenarios.
The other fatigue signal is the third-time-through-the-order effect. Starters typically lose their effectiveness as they cycle through the lineup for the third time, and managers in 2026 are pulling starters at increasingly aggressive trigger points to avoid that decline. For prop bets on hitters likely to face the starter for a third time, the probability of contact and quality contact is meaningfully higher in those at-bats. For strikeout props on the starter, the effective innings ceiling has compressed – the pitch clock has shortened games, but it has not extended starter usage, and the typical 2025 outing settled around six innings even for elite arms.
Step Four: Layer Park and Weather
The fourth step is the ballpark and weather check, and this is where the home-run prop in particular lives or dies. Each MLB venue has its own park factor for run scoring, doubles, triples and home runs. Coors Field in Denver is the extreme on the high end; Oracle Park in San Francisco is the extreme on the low end. Most parks sit somewhere in between, but the spread is wide enough that ignoring it costs real expected value.
Weather adds a multiplier on top of the park factor. Temperature is the cleanest single weather variable: every degree Celsius above the venue’s seasonal average lifts home-run probability by roughly 1.96%. Across a typical summer afternoon at a hitter-friendly venue, a five-degree temperature swing materially shifts the home-run prop. Wind direction and speed compound the temperature effect – a steady out-blowing wind to right field at a venue with shorter right-field dimensions can push the home-run prop probability up by a meaningful percentage that the operator’s morning price often does not fully capture.
The integration step is to combine park factor, temperature, and wind into a single daily multiplier on the player’s baseline projection. A power hitter with a 12% home-run-per-fly-ball rate at a neutral park in neutral weather has a different probability profile to the same hitter at Wrigley with a 28-degree afternoon and a 12 mph wind blowing out. The home-run prop price often reflects the player’s baseline; it less reliably reflects the day’s specific conditions.
Building a Daily Watchlist
The output of the four-step routine is a watchlist – a short list of props where my modelled probability differs meaningfully from the operator price. I keep the list to a maximum of five tickets per day, because spreading attention across more than that dilutes the quality of the underlying analysis. The watchlist is built before the markets reprice in the late afternoon, which means I am usually placing the bets in the two-hour window before first pitch.
The structural feature of the watchlist is that it forces a positive-edge filter. If none of the day’s matchups produce a clear gap between modelled probability and operator price, the watchlist is empty and I do not place a bet. That outcome happens more often than the marketing of prop betting suggests – there are days, sometimes whole weeks, where the operator pricing is simply too tight across the slate. Sitting out those days is part of the discipline. The November 2025 cap on pitch-level prop wagers, capped at $200 with parlay exclusion, removed one category of speculative ticket from my watchlist entirely; the remaining categories are deeper than they look.
The other discipline I built into the watchlist is the post-game review. Every prop bet on the watchlist gets a one-line write-up after settlement, recording whether my modelled probability was correct and whether the variance went my way. Across a season, the review process exposes the recurring errors in my routine – the matchups I consistently misprice, the weather conditions where my multipliers are too aggressive, the pitcher fatigue thresholds where I trust the season-long projection too much. For the deeper home-run prop methodology, my piece on MLB home run prop betting and ballpark splits goes through the multiplier maths in detail.
Why the Workflow Compounds
The honest summary of player-prop research is that there is no single insight that wins seasons. The edge comes from running the same four checks in the same order on every match day, and from sitting out the days where the watchlist is empty. The lineup check, the handedness matchup, the pitcher fatigue assessment, and the park-and-weather layer compound into a probability estimate that is meaningfully more accurate than the operator’s general projection. The discipline is the entire product, and the punter who follows the workflow is competing on the punter’s own terms – daily, specific, reality-based – which is where the prop market quietly pays.
Which MLB player props are most modellable on a daily basis?
Hits, total bases, and strikeout props on starting pitchers are the cleanest markets because the underlying probability distributions respond reliably to lineup, handedness, fatigue, and park-weather data.
How early should I check the official lineup before placing a prop bet?
Confirmed lineups typically post in the two-hour window before first pitch. Placing a prop bet before the lineup is confirmed exposes you to the risk that the player rests, even if the operator usually voids those tickets.
Does temperature really shift home-run prop probability that much?
Yes. Each degree Celsius above the venue’s seasonal average lifts home-run probability by roughly 1.96 percent, which compounds with park factor and wind direction across a single afternoon.
Written by the editors at mlb Best bet Firm.